18:36 AdSense 提醒:请勿参与任何广告互点计划 » Google AdSense 中文博客


最近我们注意到一些关于广告点击软件的反馈。请注意此类软件与 Google 谷歌无任何关联。利用此类方式产生的对Google 广告的虚假点击是被严格禁止的,并可能会导致帐户被停用。请各位发布商不要参与任何点击交换程序或任何欺诈性点击计划。

Google AdSense 一直致力于和发布商一起建立健康的广告生态环境。发布商和广告商以及用户共同组成了一个相辅相成的体系,只有当来自发布商网站的点击为广告商带来了良好的营销效果时,广告商才会继续在发布商的网站上投放广告。对 Google 广告的点击必须来自真正感兴趣的用户。以任何方式产生对 Google 广告的虚假点击和展示都是被禁止的。这些被禁止的方法包括但不限于重复的手动点击或展示、使用漫游器、自动点击和展示生成工具、可产生点击和展示的第三方服务,如付费点击、付费冲浪、自动冲浪以及点击交换程序,或任何欺诈性软件。请广大发布商能够了解并遵守 AdSense 相关政策,努力提高网站的内容和品质,才能为您获得更多的用户和广告资源,进而提升收益。大家可以在AdSense帮助中心政策页面以及博客的政策专栏了解更详细的信息。
15:15 Detailed review of Tokutek storage engine » MySQL Performance Blog

(Note: Review was done as part of our consulting practice, but is totally independent and fully reflects our opinion)

I had a chance to take look TokuDB (the name of the Tokutek storage engine), and run some benchmarks. Tuning of TokuDB is much easier than InnoDB, there only few parameters to change, and actually out-of-box things running pretty well.

There are some rumors circulating that TokuDB is ”.. only an in memory or read-only engine, and that’s why inserts are so fast”. This is not actually the case, as TokuDB is a disk-based, read-write transactional storage engine that is based on special “fractal tree indexes”. Fractal Trees are a drop-in-replacement for a B-tree (based on current research in data structures by professors at Stony Brook, Rutgers, and MIT). I can’t say exactly how it is improved, because the engine itself is closed source.

Along with its “fractal tree indexes”, TokuDB also uses compression, which significantly ( Graph 1) reduces dataset and decreases the amount of IO operations. The benefit of small size is also that TokuDB can keep in memory much more records then InnoDB / MyISAM. Actually in internal cache records are stored in uncompressed form, but OS Cache can keep compressed pages in memory. For the data set we tested, TokuDB used 6.2x less disk space than InnoDB, and 5.5x less disk space than MyISAM.

For tests I used Dell PowerEdge R900, with RAID 10 on 8 disks (2.5″ SAS disks, 15K RPMS) and 32GB of physical RAM, but restricted on kernel level to 4GB to emulate case B-Tree does not fit into memory.
As benchmark software I tried iiBench, which you can take there https://launchpad.net/mysql-patch/mytools

What makes fractal indexes so interesting is the amount of IO operations to update index tree is significantly less than for usual B-Tree index. It’s as if Fractal Trees turn random IO into sequential IO. This is why you see the results that you do in iiBench test ( Graph 2), and the number of inserts/sec is almost linear even when table size bigger than available memory. For the last 10M rows inserted, InnoDB averaged 1,555 rows/sec while TokuDB averaged 16,437 rows/sec - about 10.6x faster. One consequence of having such fast indexes, is that you can maintain a richer set of indexes at a given incoming data rate, enabling much higher query performance.

Beside iiBench we run benchmarks of SELECT queries again one of our click analyzing schema, in two modes - 1. data size is much more then memory and 2. data fits into memory.

As you see in IO-bound case TokuDB outperforms InnoDB 1.4-2.5x times, but CPU-bound is not so good. I think there we meet one of current restrictions of TokuDB - SERIALIZABLE isolation level for transactions.

Speaking about restrictions, the current problems I see are:
- Transactions only support the SERIALIZABLE isolation level. Beside it TokuDB does not scale well on multi-cores even in only SELECT queries. What this practically means it that you can’t get benefit of multi-core boxes running concurrent threads. Tokutek plans to fix this in one of the next releases.
- We did not tested wide range of queries, but by design expect there may be not good results for some kind of queries, i.e. point select queries, as in this case TokuDB has to read and decompress big portion of data.
- Despite Inserts and Deletes are fast, updates are not expected to show the same performance gain, as to update we need to read data, and in this case - read previous comment.
- The version we tested did not yet support recovery logs. The code for it is ready, and will be available in a release soon.
- The ways to do a backup is mysqldump/mysqlhotcopy. It is not fully transparent backup, as it applied TABLE LOCK on copying table. When recovery logs are supported, I guess it will be possible to run LVM backup. Actually I would say backup is only partially the problem of storage engine. The biggest problem is that MySQL does not yet provide an interface for that. This is going to be fixed in MySQL 6.0, but I can’t yet say how it will work with mix of storage engines.
- The Tokutek engine I tested comes in binary form and mysqld binary does not contain InnoDB. Tokutek tells me that InnoDB will be included in a future release.

With all the given advantages and drawbacks, I see a good practical usage of TokuDB for log analyzing and log reporting queries. By log analyzing I mean any kind of log producing application, it can be from simple apache logs put into mysql, application performance logs to more complex log like clicks, user movements and actions on site, visits tracking etc. While it may sound like an easy and trivial task, it is not at all. The more logs there are, the more space they take, and we have had setups where logs are 80% of total database size. Also there is the problem of being able to run custom reporting queries on logs. To do this, you often need many, often complex indexes which gives us the problem of random IO, waste of RAM memory and slow inserts. This is where I think Tokutek appears to be positioned to do quite good at. There are operation issues which make things more complex and, probably, I would not put yet TokuDB on customer production boxes, but it may good fit to non-critical slave where you can run analyzing queries.


Entry posted by Vadim | No comment

Add to: delicious | digg | reddit | netscape | Google Bookmarks

14:07 The Analytics Pro's Tools of the Trade » Google Analytics Blog
Just as having the right web analytics data is critical to making smart marketing decisions, having the right set of tools is equally imperative when it comes to testing & tuning your Google Analytics implementation. Read on to discover the tools used by one Analytics Pro in troubleshooting and solving Google Analytics problems every day.

Why you need tools and what you can use them for


Implementing Google Analytics can be easy - just copy and paste the script produced during the account or profile creation process, right? Yes, and no. For more complex websites, it's a good idea to take some extra steps yourself, or hire someone, to validate your installation and make sure everything's working as it should.

When problems arise they are usually easy to spot within Google Analytics reports. Odd data such as a high degree of "self-referrals" (visits being reported as "referred" from your own domain name), a strangely high rate of conversions for an unexpected traffic source or medium, or an amazingly low bounce rate (3.8% bounce rate isn't really good, it's broken) are signs something may be wrong.

Enter the toolbox! In it you'll find an array resources for quickly identifying the root causes of Google Analytics anomalies - those most commonly being

Tools every Google Analytics professional should have


1) The Browser to Start with: Firefox

The Firefox browser is probably the most important tool for technical debugging work with Google Analytics. The browser itself isn't what matters so much as the myriads of add-ons that are available for it. To get started on building your toolbox, get Firefox if you don't have it already (and don't worry, there are some tools for Internet Explorer too!).


2) Working with JavaScript: Firebug for Firefox

This is where the march of add-ons for Firefox begins. The first and probably most important tool in the box is Firebug, an add-on for Firefox. Use the following Firebug features when debugging Google Analytics implementations:


Firebug can do much more than just detect script errors and help you rapidly test JavaScript, but these applications are particularly useful for Google Analytics technical work, especially when used in conjunction with additional tools detailed below.


3) Working with Cookies: Web Developer Toolbar in Firefox

The Web Developer Toolbar is most useful for Cookie analysis and diagnosis when working with Google Analytics. It is much faster to use when needing to view just what cookies have are currently set for a given page you are viewing. You can easily see key information for each cookie, find the "utm" cookies, and view details such as the domain the cookies were written for and what the values are.


4) Tracking the Data Stream: Live HTTP headers

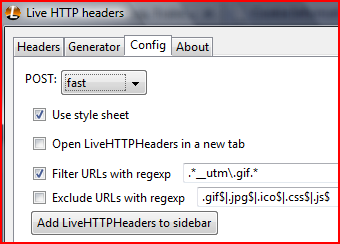
Debugging JavaScript and cookies is where troubleshooting begins. Once you are confident the scripts are working properly and cookies are appropriately set, the reporting mechanism for Google Analytics, the utm.gif tracking hit, must still take place in order for data to be reported into your Google Analytics account. Live HTTP headers is a tool of choice for identifying when these utm.gif tracking hits take place.

Bonus configuration option for Live Headers: under the "config" tab enter ".*__utm\.gif.*" (without the quotes) into the "Filter URLs with regexp" field, and make sure the field is checked. This will limit the Live Headers window to only show utm.gif hits, otherwise finding one or two utm.gif hits amidst all the other requests that will fly by may feel like the proverbial search for a needle in the haystack


5) Page Execution Speed: Chrome JavaScript Console

The JavaScript Console in Google's new Chrome Browser is perfect for detecting potential issues on sites that have a lot of other JavaScript running or have the Google Analytics tags placed on the page in a manner that other elements may slow down the code from running. The JavaScript console "resources" pane shows the number of seconds it takes for the Google Analytics script to be loaded and the utm.gif tracking hit to run.Consider this example: it took 6.58 seconds from when the browser began loading this page to when the ga.js file was loaded - and it took even more time before the utm.gif hit was fired! How many people leave before 6.58+ seconds? We will never know because of a latency issue on this page.

Tip: using this tool, if you detect a latency problem, consider optimizing the other JavaScript running on your site, optimizing image files, or placing the Google Analytics code higher in the page so that it does not have to wait for everything else to complete before it runs (note that placing the code in the of the page can bring some additional dependencies with it, so consider seeking the counsel of an experienced Google Analytics professional if considering this change).


Tools for Internet Explorer

While many will argue that Firefox or Chrome is a "better browser," we must face the reality that, for now at least, Internet Explorer sill leads the global market in browser use. Thus, if you do all your debugging in Firefox or Chrome, you may easily miss problems that would arise for Internet Explorer users. Or perhaps you're already aware of such problems and need to diagnose them further. Here are a few tools that are available for IE.


6) JavaScript Debugging in Internet Explorer: DebugBar

DebugBar is sort of like an Internet Explorer hybrid incarnation of the Web Developer Toolbar and Firebug add-ons for Firefox. Using this tool you can track down JavaScript errors in Internet Explorer in the same way Firebug works, plus some advantages. You really have to check it out to get a feel for all the features. Bottom-line: use this tool for analysis of JavaScript errors you suspect are holding up accurate Google Analytics reporting.


7) Live Data Stream Analysis in Internet Explorer: Fiddler2

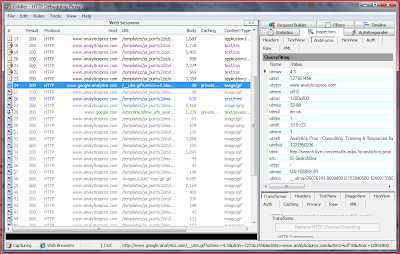
Fiddler is like Live HTTP Headers, except that it is a standalone application that can detect HTTP traffic between any application your computer and outside web servers. This makes it more accurate than Live Headers in Firefox. It can be used with Internet Explorer, but also other browsers, including Firefox. The tools for analyzing captured requests, utm.gif hits included, are superior to Live HTTP Headers in many ways.


8) Cookies in Internet Explorer: IE Cookies Viewer

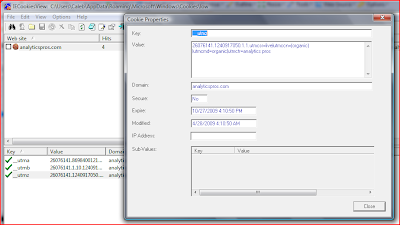
This small but powerful tool lets you easily find, view, and even modify cookies for Internet Explorer. It is indispensable for Google Analytics diagnostic and troubleshooting work when encountering cookie domain issues.


In Conclusion

So, there you have it: a plethora of tools that are tried and true means to the trouble-free Google Analytics end you're seeking. Here's a recap shortlist of the tools:
Posted by Caleb Whitmore of Analytics Pros, a Google Analytics Authorized Consultant
12:15 Product: Hadoop » High Scalability - Building bigger, faster, more reliable websites.

Update 4:: Introduction to Pig. Pig allows you to skip programming Hadoop at the low map-reduce level. You don't have to know Java. Using the Pig Latin language, which is a scripting data flow language, you can think about your problem as a data flow program. 10 lines of Pig Latin = 200 lines of Java.
Update 3: Scaling Hadoop to 4000 nodes at Yahoo!. 30,000 cores with nearly 16PB of raw disk; sorted 6TB of data completed in 37 minutes; 14,000 map tasks writes (reads) 360 MB (about 3 blocks) of data into a single file with a total of 5.04 TB for the whole job.
Update 2: Hadoop Summit and Data-Intensive Computing Symposium Videos and Slides. Topics include: Pig, JAQL, Hbase, Hive, Data-Intensive Scalable Computing, Clouds and ManyCore: The Revolution, Simplicity and Complexity in Data Systems at Scale, Handling Large Datasets at Google: Current Systems and Future Directions, Mining the Web Graph. and Sherpa: Hosted Data Serving.
Update: Kevin Burton points out Hadoop now has a blog and an introductory video staring Beyonce. Well, the Beyonce part isn't quite true.

Hadoop is a framework for running applications on large clusters of commodity hardware using a computational paradigm named map/reduce, where the application is divided into many small fragments of work, each of which may be executed on any node in the cluster. It replicates much of Google's stack, but it's for the rest of us. Jeremy Zawodny has a wonderful overview of why Hadoop is important for large website builders:

read more

08:42 XtraDB storage engine release 1.0.3-5 » MySQL Performance Blog

Today we glad to announce release 1.0.3-5 of our XtraDB storage engine.

Here is a list of enhancements in this release:

Percona XtraDB 1.0.3-5 available in source and several binary packages.

XtraDB is compatible with existing InnoDB tables (unless you used innodb_extra_undoslots) and we are going to keep compatibility in further releases. We are open for features requests for new engine and ready to accept community patches. You can monitor Percona’s current tasks and further plans on the Percona XtraDB Launchpad project. You can also request features and report bugs there. Also we have setup two maillists for General discussions and for Development related questions.


Entry posted by Evgeniy Stepchenko | 4 comments

Add to: delicious | digg | reddit | netscape | Google Bookmarks

05:09 Design Tweaks Vote » WordPress Development Blog

Comps for the header/nav design tweaks are in, and the results are mixed. Some people just moved a few things around, while others proposed a new style altogether. We won’t make any major changes to style in 2.8, but if the vote leans toward a submission that proposes it, we’ll do some user testing and make a decision for early 2.9 (which, now that we think of it, is probably the right thing to do anyway. :) )

Below are the links to the screenshots that were submitted. Please review each one (I’d open them all in tabs so I could look back and forth while they are all large size, because the voting poll just uses thumbnails), then choose the one you think looks the best/is the most usable.

This poll was supposed to close at 8pm NY time on Tuesday (today), but we’re going to leave it open for an extra day. The voting poll will now be closed at 8pm NY time on Wednesday (that’s 2am Thursday, UTC). If you want to discuss the entries’ pros/cons, this thread would be a good place.

Current: The existing interface, for reference

KM: Current nav, header elements moved

AN: Current nav, file folder style header

KD: Current nav, modified header style

JJ: Swap blog title and favorites menu

DR1: Fluency style, dark

DR2: Fluency style, medium

DR3: Fluency style, light

IK: Nav layered over dark background

GB: Modified nav/header intersection

MT: Modified nav and header

Results will be posted the day after the polls close.


^==Back Home: www.chedong.com

^==Back Digest Home: www.chedong.com/digest/

<== 2009-04-27
  四月 2009  
    1 2 3 4 5
6 7 8 9 10 11 12
13 14 15 16 17 18 19
20 21 22 23 24 25 26
27 28 29 30      
==> 2009-04-29